Our reports are now interactive
Click through the charts, switch products and pick a state. Choose a report below to open its latest full interactive edition, exactly as subscribers see it on our website. The full PDF is still attached to every report.
Choose a report
September 2026 US Milk Production Report Analysis
Published 23 October 2026Key Takeaways
- US milk output rose 2.6% year over year in September to 19.4 billion lbs, the largest gain since June and the eighth month of 2%-plus growth in 2026.
- August was revised up 139 million lbs, one of USDA’s largest revisions ever, lifting August growth from 1.7% to 2.4% as milk per cow rose 13 lbs and the herd 7,000 head.
- The herd reached 9.74 million head, up 169,000 from a year ago and 26,000 from August, while milk per cow rose 0.9% year over year.
- Wisconsin led growth (+88 million lbs), followed by Kansas (+63) and Texas (+62). Arizona fell 18 million lbs, the largest of only four state declines.
- HighGround’s take: clearly bearish versus expectations. With margins still positive, growth should continue, though USDA could pull September’s numbers back next month.
HighGround’s Opinion
These results were clearly bearish to expectations. After August’s initial +1.7% YoY print, expectations were for another month of less than 2% growth. However, with major revisions and more cows added to the herd, milk output surged. The ongoing growth in the US is almost unfathomable. Looking at 2026 milk production, only three states, New Mexico, Washington, and Pennsylvania, all of which have various infrastructure, policy, or cost issues, are down from 2025. With margins in the black, even if smaller than in early 2026, expect the trend to continue. The bigger wildcard now is if USDA pulls back these big September numbers when it issues next month’s report, lowering them to reflect the expected growth.
AnalysisRead more ▾Show less ▴
September’s milk production posted the largest year-over-year gain since June 2026, as the hits just keep coming. Also, for the second consecutive year, milk volumes increased from August to September, a period when production has historically declined seasonally. This year’s 50 million-pound increase between the two months was the largest on record.
In a line that is becoming repetitive, “but first, the revisions.” After August’s report showed a sizable upward revision to June’s output and September’s revealed significant downward changes to July’s production, this report followed the pattern, with a large upward revision to August’s initial print. The 139 million-pound change was one of USDA’s largest revisions ever, raising the 1.7% YoY gain to 2.4%. August’s herd was revised higher by 7,000 head, meaning cow numbers increased by 32,000 head from July to August, ranking among the top ten largest monthly increases on record. Two other months in 2026, January and June, also rank in the top ten, highlighting just how many cows have been added to US dairies this year. USDA added a whopping 7,000 cows to Wisconsin’s herd and 4,000 to neighboring Iowa. ID, MI, and OH each added 3,000 head, while CA, IL, and NY each added 2,000.
August’s milk per cow also rose 13 pounds, turning yields from a negative YoY print to positive. This major productivity revision ranks as the third-largest change to milk per cow following the initial print. Ohio’s milk per cow rose 30 pounds, while Illinois, Michigan, New York, and Wisconsin each saw a 25-pound increase. Overall, Wisconsin saw the largest revision from the initial estimate (+48 million pounds), while Illinois and California earned honorable mentions for their increased output (+21 million pounds each).
Back to September. The US herd swelled by another 26,000 cows month over month, marking another large gain. The largest increases (+5,000 MoM) occurred in Idaho, Indiana, and New York. In Wisconsin and Michigan, milk cow numbers climbed by 3,000 head each. Only Arizona (-3,000) and Florida (-1,000) reported declines from August to September. Since the US herd began expanding in June 2024, the country has added 421,000 cows, the largest herd expansion in USDA data dating back to 1980. September’s herd totaled 9.743 million head, the largest since Q1 1992. Further, the July-to-September gain of 58,000 dairy cows represents the second-largest two-month increase since 2000, with the largest occurring over the same period in 2025.
Milk per cow also posted a MoM gain (30-day adj), the first August-to-September gain since 2001. On an annual basis, yields improved by 18 pounds, or 0.9%, the second-largest YoY increase in 2026, and impressive given July’s negative reading. Typically, if cows experience a setback in their lactation cycle, they recover modestly, so the improvement from -0.1% YoY in July to +0.9% in September is notable. By state, GA, ID, IL, IN, KS, MI, NY, WA, and WI all saw productivity gains of 25 pounds or more year-on-year in September.
California deserves a call-out. It was the only state with a decline in yields, -5 lbs. year-over-year; however, increased cow numbers there drove a one-million- pound increase from September 2025, the first green shot after three months of decreases. Some supply management programs in place there are being lifted, which could mean more milk in the coming months.
Just four states saw decreased milk flows: Arizona, New Mexico, Illinois, and Utah. The Southwest losses are interesting and likely due to water restrictions, aging assets, and other operational issues.
National Scorecard
Explore by State
Click a state on the map or pick one below. Shaded by year-over-year change.
Source: USDA. Adjusted to 30 days. N/C = no change.
View States
Choose a measure. Click a state name to open it above.
Source: USDA Milk Production report via HighGround Dairy. Year-over-year changes in pounds Adjusted to 30 days. ⚑ = August figures revised in this report. N/C = no change.
Source: USDA Milk Production report via HighGround Dairy, US Milk Production Analysis – September 2026 (23 October 2026). Volumes in million lbs, herds in 1,000 head, milk per cow in lbs. State and national volumes are monthly totals; year-over-year changes in pounds (map and state views) are Adjusted to 30 days, so they may differ slightly from volume × percent change. N/C = no change. Full state tables and charts are in the PDF.
Key Takeaways
- Total cheese production grew at its slowest year-over-year rate since December 2025, when volumes dropped by this measure. September’s 0.7% year-on-year gain was limited by lower Cheddar output, helping explain some of the run-up in spot prices in October.
- An additional 20.1 million pounds of butter was made in September compared to the same month last year. Most of this was due to a 24% increase in the Western region, marking a new record high on a 30-day adjusted basis and pushing year-to-date totals above one billion pounds, the fastest they have ever reached that level.
- Massive revisions were made to August’s high-protein whey stocks. WPC 80 was taken up by 3 million pounds (+8.3% of actual), while WPI moved higher by 584,000 pounds (+3.5% of actual). The building stocks suggest decreasing demand due to high prices in the complex.
- Processors are making more NFDM to try to quell demand from the American and Mexican markets. Without Southeast Asian demand, skim milk powder (SMP) production fell to the lowest level on a 30-day adjusted basis since May 2012. When combined, NFDM/SMP output is below the prior year, supporting the current elevated price point.
Production at a Glance
US Dairy Products Production: September 2026
| Commodity | Million Pounds | Metric Tons | vs. Last Year* | vs. Two Years* | vs. Last Month* | YTD vs. Last Year* |
|---|---|---|---|---|---|---|
| Natural American | 464.3 | 210,583 | −2.5% | +4.1% | +0.3% | −0.3% |
| Cheddar | 310.2 | 140,712 | −4.2% | +2.1% | −1.9% | −0.6% |
| Other American | 154.0 | 69,870 | +1.2% | +8.4% | +4.9% | +0.3% |
| Gouda | 7.7 | 3,481 | +11.4% | +102.0% | −0.7% | +12.4% |
| Mozzarella | 424.6 | 192,590 | +4.4% | +8.4% | +0.1% | +3.0% |
| Cream & Neufchatel | 98.0 | 44,438 | −2.7% | −1.5% | +4.5% | +4.2% |
| Parmesan | 52.5 | 23,797 | +14.8% | +64.8% | +1.7% | +19.5% |
| Total Cheese | 1,233.0 | 559,301 | +0.7% | +6.9% | +0.8% | +2.3% |
| Butter | 204.0 | 92,535 | +10.9% | +27.0% | +12.5% | +6.5% |
| Yogurt | 485.6 | 220,266 | +4.4% | +14.5% | +7.2% | +5.3% |
| Cottage Cheese (low fat + cream) | 84.0 | 38,103 | +8.5% | +24.7% | +4.8% | +9.8% |
| Dry Whey (human) | 70.3 | 31,886 | +3.4% | +7.9% | 0.0% | +9.7% |
| WPC 25–49.9% | 8.0 | 3,632 | −29.5% | −31.1% | +8.8% | −22.1% |
| WPC 50–89.9% | 33.8 | 15,321 | +6.9% | +20.1% | −2.3% | +5.8% |
| WPI 90%+ | 20.5 | 9,283 | +8.9% | +19.6% | +27.3% | +7.0% |
| Lactose | 92.0 | 41,742 | −2.8% | −2.2% | +0.1% | −3.1% |
| Milk Protein Concentrate | 26.3 | 11,909 | +27.8% | +13.2% | +26.3% | −9.9% |
| Whole Milk Powder (WMP) | 6.7 | 3,059 | +2.8% | −13.6% | −24.6% | −7.3% |
| Nonfat Dry Milk (NFDM) | 129.4 | 58,706 | +3.7% | +12.5% | +3.6% | +9.6% |
| Skim Milk Powder (SMP) | 19.1 | 8,668 | −58.8% | −64.1% | −31.6% | −25.7% |
| Combined NFDM/SMP | 148.5 | 67,374 | −13.3% | −11.8% | −2.9% | +1.7% |
Source: USDA NASS, Dairy Products · *Adjusted to 30 days · Metric tons converted from pounds
US Dry Products Stocks: September 2026
| Commodity | Million Pounds | Metric Tons | vs. Last Year | vs. Two Years | vs. Last Month |
|---|---|---|---|---|---|
| Dry Whey (human) | 57.5 | 26,101 | +12.8% | +8.2% | −7.2% |
| WPC 25–49.9% | 12.2 | 5,530 | −44.3% | −30.6% | −6.2% |
| WPC 50–89.9% | 39.1 | 17,750 | +35.0% | +18.3% | +8.4% |
| WPI 90%+ | 20.0 | 9,071 | +42.7% | +33.7% | +2.6% |
| Lactose | 99.7 | 45,204 | +7.7% | −17.5% | −5.1% |
| Buttermilk Powder | 25.7 | 11,662 | −3.0% | −4.3% | +1.0% |
| Nonfat Dry Milk | 206.7 | 93,753 | −4.9% | +15.3% | −4.5% |
| Whole Milk Powder | 11.3 | 5,114 | +5.8% | −3.7% | −22.5% |
Source: USDA NASS, Dairy Products · Month-end stocks · Metric tons converted from pounds
Analysis by Product
This report was neutral to expectations. Although production was not up as much as earlier in 2026, cheese prices have moved out of the cellar, suggesting markets are pricing in slightly slower growth. More milk is on the horizon in the US, meaning more cheese. As US prices lose some of their advantage relative to international markets, exports may slow, causing supplies to stack up and prices to fall.
Cheese Analysis
Production and Cheddar
Total cheese production grew by the smallest margin in almost two years, although stocks continue to grow year-over-year, suggesting weak demand, particularly domestic. Another round of weak foodservice results has been published, illuminating the main culprit behind declining domestic sales. The August-to-September increase of 0.8% was below the five-year average of 2%, suggesting milk flows were diverted to other commodities and ingredients.
Weak Cheddar production has been an ongoing storyline in 2026. September’s totals sank by 4.2% relative to 2025, the largest decrease since December 2023. Year-to-date through September, Cheddar vat output lags 2025’s records by 0.6% or 17.7 million pounds. Since July, year-to-date totals have trailed the prior year, seemingly driven by the weak US foodservice sector. The smaller totals for this variety have brought Natural American cheese production year-to-date down compared to 2025. However, Other American types, like Colby & Monterey Jack, are up marginally relative to January to September 2025 and notched another month of annual growth in September (+1.2%).
Other than American
Meanwhile, output of Other than American cheeses continued to swell, and September notched the second-highest total all-time, 768.8 million pounds on a 30-day adjusted basis. US cheese exports have been record-setting in 2026, with Cheddar and American-style cheeses making up a small fraction of these, and “other than American” types making up the lion’s share. In other words, strong international demand is a major factor for growth in this category in 2026.
Mozzarella production impressed yet again, with year-on-year totals rising since December 2023. While stateside pizza chain sales have slowed, exports and new plant capacity seem to have kept product coming. YTD through September, Mozzarella vats have produced an additional 111 million pounds of cheese (+3%).
Not only have Parmesan totals grown year-over-year for the past 19 months, but they have also been up by double digit percentages 17 of those months. Demand has been insatiable as consumers turn to products that are both low-fat and high-protein, like hard Italian-styles. Further, a modest health halo is emerging, as many with dairy sensitivities or other digestive issues can eat aged hard cheeses without issues.
Cream and Neufchatel cheese figures decreased relative to September 2025, marking the second month in a row of a decline. With huge fat supplies in the US, this is another avenue to absorb excess butterfat. That said, 2026’s year-to-date totals through September easily rank second over the past ten years.
Regions
Regionally, the Central US saw the largest year-over-year gain on total cheese, +1.1%, of the three areas tracked. That said, September totals were the second-smallest of the year behind January. Cheddar output stumbled, falling 5.5%, and at just 173.7 million pounds, was at its lowest level since new cheese assets began ramping up in the region at the start of 2024. Mozzarella fared better, rising by 8.2% YoY, or +12.8 million pounds. Exports are likely driving the Mozzarella totals. Mexico is the top international destination for US cheese and given that the new Central region plants are not far from the southern border, it is plausible these processors are fulfilling international orders.
Atlantic vats slowed on an annual basis for the second consecutive month. While cheese production in the area has been decent in 2026, heavy demand for Class II and ultrafiltered milk may have pulled some milk away from cheese manufacturers. Pennsylvania’s cheese output dropped a dramatic 9.1% from Sep 2025, pushing the year-to-date into negative territory and to their lowest Jan-Sep total since 2022.
Butter was neutral to expectations, simply because the trend of more butter persists, and it is difficult to be bearish when the CME spot market closed on November 6 at $1.2650/lb. By this time of year, pipelines for holiday demand are filled. There may be a few pockets of demand that pop up here and there, as there usually are, but for the most part, the seasonal lift has been covered, which means excess butter is bound for storage. It is no surprise, then, that butter inventories have swelled and will likely remain this way into spring flush.
Butter Analysis
Production
Butter galore! In September 2026, the US produced 10.9%, or 20.1 million pounds more butter than the same time last year. Compared to two years ago, the US produced 43.2 million pounds more butter in 2026! Producers heard the call for more milkfat, and they continue to deliver, providing ample supplies for butter-making. Year-to-date through September, the US has produced 1.9 billion pounds and likely to surpass the 2-billion-pound mark in October for the first time ever. Compared to 2025, the US has made an additional 116.8 million pounds in 2026, and an extra 242.9 million pounds versus 2024.
Regions
A standout this month was an upward shift in butter output in the Western region. Production in this region typically increases between August and September, but the 14.4% Aug to Sep gain was significantly larger than the 2.7% five-year average build. Moreover, the Western region produced 118.4 million pounds of butter in September, an all-time high on a 30-day adjusted basis and +23.6% versus the same time last year. This pushed YTD totals through September for the region above one billion pounds for the first time ever.
When diving deeper into the data, California butter output was up 4.6% year-on-year in September. Although this is a gain, it does not explain or account for the substantial increase in Western butter production, suggesting output may have risen sharply in other parts of the West such as Idaho, Washington, Utah or Arizona.
In September, the West accounted for 58% of total US butter production and was the only region to report growth from the prior year. The Central region produced 1.9% less butter than in September 2025, dragging YTD totals down to +2.7% from the +3.3% recorded in August. Meanwhile, Atlantic output dropped 8.9% from September 2025, with YTD volumes dragging 2025 down by 5.3%.
NFDM was neutral to expectations. Insatiable protein demand keeps the battle for skim solids an ever-difficult fight and thus NFDM production under pressure. Demand will need to quell, or production will need to rise substantially—a difficulty previously discussed—for stocks to begin to build and prices to ease.
Milk Powders Analysis
Nonfat dry milk
For a moment, it looked like the CME spot nonfat dry milk (NFDM) market may drop back below $2.00/lb. in late October, but that changed quickly and the price is once again back up near $2.20/lb. The volatility of this market this year has been immense. Although production is attempting to satiate demand, there is little in inventory to pull from and skim solids are being pulled in other directions from the dryers, making for a hard-fought protein battle.
Most of the demand for NFDM is domestic with exports mostly headed to Mexico, which helps explain why NFDM production persists above prior year levels while skim milk powder (SMP) languishes. NFDM production was up 3.7% YoY in September and did follow the seasonal increase from August to September. All of this growth was driven by the Western region with output up 15.4%. California dryers saw a 12.8% YoY lift as well. It is clear that Central region skim solids are bound for other products such as cottage cheese, as output of NFDM here plummeted 20% versus September 2025.
Skim milk powder
SMP in the US is predominately made for the export market. Typically, this product was bound for Southeast Asia but buyers dispersed quickly when powder prices began to soar. Year-to-date through September, exports of NFDM/SMP to that region have been down 15,296MT (-11.6% YoY), which explains why SMP production has declined so drastically to just 19.1 million pounds, the lowest level on a 30-day adjusted basis since May 2012.
When combined, the substantially low level of SMP production offsets the minor gains in NFDM output to drag totals down 13.3% YoY. As mentioned, the domestic American market is clearly where the strong demand lies, aided by Mexican demand, and both places use NFDM. Without Southeast Asian purchasing, there is little motivation for processors to make SMP.
Stocks
Given the high price point for CME spot NFDM and marginally higher production, it is not surprising to see stocks trend below prior year levels. When prices skyrocketed earlier this year, buying backed off, and the days in inventory started to accrue. In September, days in inventory began to dip again, and prices shot right back up.
Dry whey was neutral to expectations. Prices are historically lofty but given that supply is not quite keeping up with demand, it is not overly surprising to see elevated markets. The US has lost its price advantage to European whey, so demand may slow in the coming months and ease pressure on prices.
WPC 80 and WPI were slightly bearish to expectations. Stocks are building. WPI prices have not pulled back, even though stocks are recovering. WPC 80 prices have dropped, but with the ballooning inventories, it seems like there is room for even further declines. WPC 25-49.9% was neutral to expectations.
Whey & Proteins Analysis
Dry whey
September’s dry whey production was almost unchanged from August (+0.04% or +28,300 pounds), abnormal when compared to the five-year month-over-month mean of +3.1%. While more dry whey was made in September 2026 than in September 2025, the 3.4% increase was the smallest year-over-year change since April 2025 when volumes fell by this measure.
It seems like dry whey is in demand, though. Exports have been moving at a clip, with September’s total ranking second all-time, just behind August’s record. Demand from China, Canada, Indonesia, and Japan all grew by 1,500MT (+3.4 million pounds) or more year-over-year in September, helping to buoy export totals.
As a result, stocks dipped lower from August to September by 7.2% (-4.5 million pounds), more than the five-year average of a 3.2% decline. The drawdown is telling, though, as production grew modestly, suggesting strong export demand outpaced supply. As much as they can, processors are moving the whey stream into high-protein products, thereby limiting output of sweet whey powder.
WPI and WPC
The big headline in the whey complex was revisions to August’s WPC and WPI stocks. Both items in the high-protein space were taken higher, suggesting that high prices may have finally slowed demand. WPI levels were updated by 584,000 pounds, or +3.5% of the actual and WPC 80 inventories rose by three million pounds, or +8.3% of the actual. Meanwhile, WPC 34 stocks, which were already weak, were lowered by 38% of the actual, or down five million pounds.
In September, WPC 25-49.9% production dropped significantly, -30% from the prior year. Despite the big fall in output, stocks continued sliding, down on both a monthly and annual basis. Market chatter is that buyers are re-formulating to NFDM, which is more readily available.
WPC 80 volumes ticked higher year on year, as expected, as production has increased for over a year and a half. Stocks began to buck the trend line, though, and built month-over-month for the fifth time in six months, reaching their highest level since September 2023. It seems that supplies are finally keeping up with demand, as high prices have likely curbed some sales.
WPI volumes matched the 30-day adjusted record, totaling 20.5 million pounds, up 27% from August, or +4.4 million pounds. That said, inventories marched uphill, rising by a half million pounds from August, marking the third month in a row of a monthly increase. September’s levels were just under 20 million pounds, the highest since August 2023.
Lactose was neutral to expectations. Prices are high but not enough to catalyze greater lactose production. Stocks dipped seasonally from August to September but are above 2025 levels, suggesting demand was fairly stagnant.
Lactose Analysis
Production and stocks
Lactose production was the lowest in September since 2022, dragging year-to-date totals down 3.1%. Lactose prices in the US currently sit at $0.73/lb. (Dairy Market News weekly midpoint) and have been on a tear upwards since September 2024. However, this has not been enough to spur additional production.
Stocks slipped 5.1% lower from August but still held above 2025 levels. Despite the reduced output compared to 2025, lactose inventories have managed to build, indicating that demand is not overly supportive. This is contrasted by the high lactose price point and suggests the price and supply-demand fundamentals are not aligned.
Class II Products at a Glance
Click a product to view its chart.
| Product | Sep 2026 | vs. Last Year* | vs. Last Month* | YTD vs. Last Year |
|---|---|---|---|---|
| Yogurt | 485.6 mil lbs | +4.4% | +7.2% | +5.3% |
| Cottage cheese (low fat + cream) | 84.0 mil lbs | +8.5% | +4.9% | +9.8% |
| Low fat cottage cheese | 41.1 mil lbs | +8.1% | +5.0% | +10.6% |
| Cottage cheese cream | 42.9 mil lbs | +8.9% | +4.7% | +9.1% |
| Sour cream | 125.9 mil lbs | +1.3% | +6.5% | −0.6% |
| Ice cream (regular, hard) | 62.4 mil gal | +5.6% | −0.7% | +3.1% |
Source: USDA NASS, Dairy Products · *Adjusted to 30 days
Class II Analysis
Production and demand
Both cottage cheese and yogurt output marked a new all-time high on a 30-day adjusted basis in September. Protein has become expensive, even in the dairy space, as whey and NFDM prices soar. However, cottage cheese and yogurt remain versatile products with ample protein at a reasonable price. The Consumer Price Index for dairy noted a decline in September compared to the same time last year, in stark contrast to other food categories and an overall higher total food increase of 2.5%. Against other foods, especially other proteins, dairy products such as cottage cheese and yogurt remain a low-cost option that will likely support further consumption.
Class II milk price
Strong consumer demand for Class II dairy products continues to support elevated production. However, Class II dairy product manufacturers are paying more for their milk due to lofty nonfat dry milk prices which are factored into the Class II milk price calculation. The monthly advanced Class II skim price, part of the Class II milk price, peaked in 2026 at $17.45/cwt in June, but the second 2026 rally in nonfat dry milk prices is driving the Class II skim price higher once again, reaching $16.73/cwt. in November.
Select a Chart
Other-than-American Cheese Stocks Set New September Record
Butter stocks grow by largest YoY gain since January 2023
US Cold Storage Ending Stocks: September 2026
| Commodity | Million lbs | Metric tons | vs last year | vs two years | vs last month | August revision (mil lbs) | Revision % of actual |
|---|---|---|---|---|---|---|---|
| Butter | 295.7 | 134,115 | +16.5% | −2.5% | −5.0% | −4.31 | −1.4% |
| Natural American Cheese | 792.2 | 359,342 | −1.6% | +1.3% | −1.8% | −8.84 | −1.1% |
| Other-than-American Cheese* | 636.3 | 288,640 | +7.7% | +8.5% | +0.1% | +8.29 | +1.3% |
| Total Cheese | 1,428.6 | 647,982 | +2.4% | +4.4% | −0.9% | −0.55 | N/C |
Source: USDA NASS Cold Storage. Ending stocks in million pounds; metric tons converted at 2,204.62 lbs per metric ton. *Other-than-American cheese includes Swiss. Revision = change to last month’s first estimate. N/C = no change (Total Cheese revision was −0.04%).
Butter Analysis
This outcome was neutral to expectations. The market has felt heavy with product this year, and this report confirms that sentiment. With butter prices depressed in the $1.30s, it is hard to be any more bearish.
Analysis
Butter stocks continue to balloon, up over 16% versus the prior year, or +41.8 million pounds, the largest increase by this measure since January 2023. Inventories declined seasonally, but less than they normally would from August to September (five-year average of −25.5 million pounds), down 15.7 million pounds, the smallest drop between these two months since 2022.
Butter stocks began their monthly decreases in June, and since then, just 39.7 million pounds of product has moved out of storage, the smallest amount from June to September since 2020. While butter demand domestically and abroad has been decent, less is being pulled from warehouses to meet needs, and current production is also helping fill orders.
August’s data was revised lower by 4.3 million pounds, or −1.4% of the actual. However, given the huge amount of butter in the US, this alteration simply moved the year-over-year gain from +10.3% to +8.8%, still a large gain. USDA’s updated figures showed a July to August drop of 21.1 million pounds, the smallest drawdown in that timeframe since 2020, when inventories grew month-over-month.
Milk production continues to grow domestically, rising 2.6% in September compared to a year ago. While no fat test data is available yet for September, HighGround forecasts a 1% increase in this metric, meaning total butterfat pounds would rise 3.6%, or +29 million pounds. Churns are feeling the weight of the heavy fat supplies, with production up 6% (+97 million pounds) year-to-date through August. While September’s data will not be released for another week, these volumes will likely continue at this clip. Skim solids are in demand, and separating cream from milk to harvest the high-priced protein leaves plenty of raw materials for butter makers.
Butter Ending Stocks
Source: USDA NASS Cold Storage; HighGround Dairy calculations.
Sources: USDA NASS Cold Storage; USDA NASS Milk Production; CME; HighGround Dairy calculations and forecasts. Butter prices referenced are CME spot butter. Five-year average covers 2021–2025.
Cheese Analysis
Cheese was neutral to our expectations. Natural American cheese stocks have tightened slightly, but much of that has been priced into spot markets. Further, with Other-than-American cheese inventories growing, there is little bullishness in this market.
Analysis
Cheese stocks grew year-over-year for the third consecutive month, up 2.4%, almost matching August’s +2.3% year-over-year increase. Inventories totaled 1.429 billion pounds, ahead of the same month in 2024 but down from the stock-heavy years of 2021–2023. Month over month, warehouse levels fell by 13.6 million pounds, more than the five-year average of −7.6 million. August’s totals were barely revised, but Natural American and Other-than-American cheese stocks were revised in opposite directions by about eight million pounds, canceling each other out and keeping the aggregate almost the same as the initial print (−550,000 pounds).
Declining Natural American cheese stocks were the reason for the large monthly drawdown in total cheese inventories. From August to September, warehouse levels decreased by 14.5 million pounds, exceeding the 2021–2025 mean of −200,000 pounds. Although capacity is ample, American cheese volumes through August are down (−0.1%) slightly from 2025’s record levels, while Italian varieties are growing (+4.2% YoY). Mozzarella and Gouda are commonly exported cheeses, and processors are likely making these instead of Cheddar and Colby. Smaller production is the likely reason for the continued decline in Natural American stocks. Strong demand is unlikely, as poor foodservice sales, a major user of Natural American varieties, have been an ongoing theme in 2026.
Other-than-American cheese stocks set a new monthly record for September, the first since 2023. Warehouse levels are building, +7.7% versus the prior year, the largest increase by this measure since April 2019. On a monthly basis, inventories also rose by 800,000 pounds, bucking the seasonal trend.
Cheese Ending Stocks
Source: USDA NASS Cold Storage; HighGround Dairy calculations.
Sources: USDA NASS Cold Storage; USDA NASS Dairy Products; HighGround Dairy calculations. Other-than-American cheese includes Swiss. Five-year average covers 2021–2025.
Key Takeaways
- Dry whey exports ranked second of all time, down only from August’s all-time high.
- WPC≥80 shipments fell YoY for the eleventh time in 12 months, with near-record prices likely to blame.
- Nonfat dry milk and skim milk powder jumped 30% MoM, on greater shipments south of the US border.
- Butter exports bounced back to over 8,000MT, well above the historical average.
- Cheese exports eased from 2026 records, and Cheddar exports were the lowest since November 2025.
HighGround’s Opinion
Some of the US’s price advantage in global cheese markets has eroded, the price gap between US NFDM and global SMP markets is widening, and the US has lost its discount relative to EU whey, all of which may limit further export growth.
Analysis
Read moreShow less
In September, the US exported 252,791MT of dairy products, up 12.4% from a year ago (+27,789MT), ranking seventh all time in volume. In dollar terms, September’s total of $993.2 million was a record. While cheese exports have stepped back from the highs set in June and July 2025, they still provide strong support for overall export totals. Further, high whey prices and strong volumes for dry whey and WPC<80 also boosted totals in both monetary value and volume. Mexico was a major contributor to the volume increase; exports rose by 11,223MT (+18.5% YoY). Regionally, buying also grew in Southeast Asia (+5,068MT, +16.7% YoY), Central America (+3,237MT, +40% YoY), and South America (+3,054MT, +22% YoY). Just over 456 million pounds of solids were exported, representing 17.6% of US milk production, an increase of 10.3% (+42.6 million pounds) from September 2025.
Dry whey exports turned in an impressive result in September, down from August’s all-time high, but ranking second of all time on a 30-day adjusted basis. Multiple countries saw gains of 1,500MT or more, with Canada seeing the largest increase: +4,286MT.
WPC≥80 shipments fell YoY for the eleventh time in the past 12 months. WPC 80 and WPI prices have been at or near record highs for some time and are likely driving the export drop. In September, the largest YoY volume declines were to Singapore, Brazil, and India. On a YTD basis, sales have fallen the most, by 2,300MT or more, to China, Brazil, and Japan.
Nonfat dry milk and skim milk powder saw a nice bump from August (+30% MoM), due to greater shipments south of the US border. For example, sales to Mexico were up by 5,585MT (+19%) compared to September 2025, while totals to South America increased by 1,394MT (+36%).
Butter exports bounced back from July’s total, and at over 8,000MT were well above the historical average. While the discount the US carried relative to EU and Kiwi manufacturers has eroded in 2026, it remains significant, which has kept international buyers interested. In September, Bahrain (+1,797MT compared to 0MT in Sept 2025) and Canada (+1,296MT, 83% YoY) were the top two export destinations.
Cheese exports were large from a historical standpoint, but down from the records set earlier in 2026. Weak American cheese demand has been part of the chatter over the past month, and Cheddar exports were the lowest since November 2025.
Exports at a Glance
US Dairy Imports: Executive Summary
- Butter imports rose by triple digits YoY for the sixth month in a row, but retreated from recent highs. September imports dropped MoM to their lowest level since February. Irish imports accounted for over 70% of the market share, up from 28.6% a year ago.
- Casein imports posted their fourth consecutive month of YoY declines, and year-to-date through September totaled just 40.6 million pounds, the lowest January-to-September figure in the data dating back to 2000. Irish imports actually grew (+687MT, +708% YoY), and it was the decline in Kiwi imports (-1,249MT, -67% YoY) that drove the smaller totals.
- Milk protein concentrate (MPC) volumes decreased year-over-year. For MPC 90%, this marked the fifth consecutive month of YoY declines. However, for MPC>40%, another down month is par for the course, as seven of nine months in 2026 have shown a decline. Year-to-date through September, both varieties are firmly down. High skim solids prices and tight supplies are likely reasons for the slowed imports.
Explore by Product
Where It Went
Key Takeaways
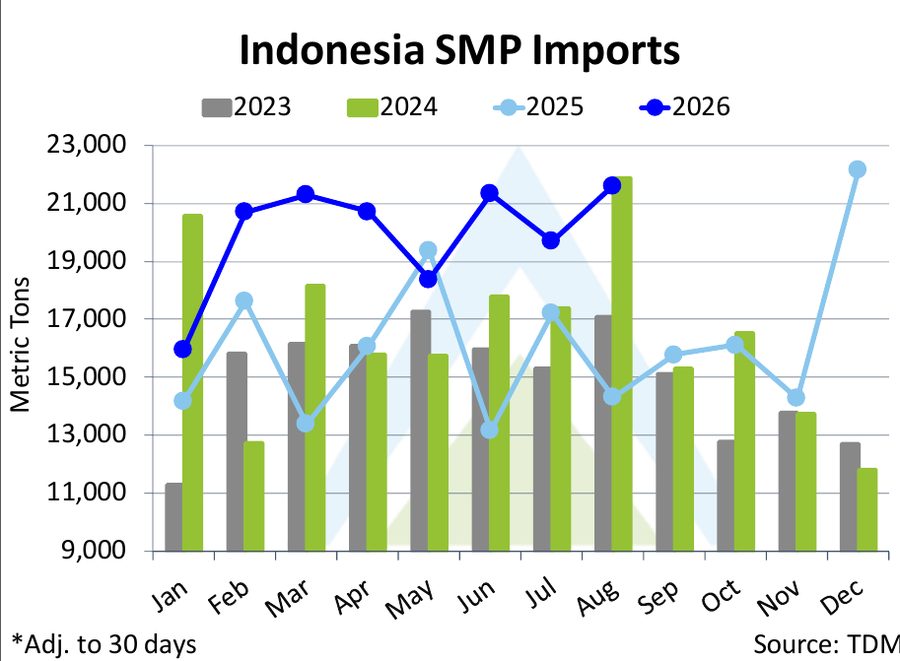
- Indonesia’s SMP imports hit a 2026 high. August volume rose 51% YoY to 21,612MT as Australian (+104%) and Belgian (+107%) shipments climbed and the US share fell to about 5%.
- US butter and cheese keep winning in East Asia. The US was Japan’s top butter supplier in September at 491MT (+878% YoY), and US cheese is up 31% YTD in South Korea and 63% YTD in Indonesia.
- South Korea’s butter imports are at a record pace, up 28.5% YTD to 27,035MT through September on demand from its bakery and café sector.
- Lower New Zealand WMP prices brought buyers back. WMP imports rose 54% in Indonesia and 41% in Malaysia in August, and 84.5% in South Korea in September. Thailand’s fell 24% to a three-year low.
- European SMP is replacing US product in Southeast Asia. Germany (+543%) and France led Vietnam’s July SMP gains while US volume fell 75%, and Ireland shipped a record 1,823MT to Malaysia in August.
Explore by Country
Click a country on the map or below to see every product, with the latest month or the year to date.
Compare a Product Across Countries
Year-to-date volume for each market, through its latest reported month.
Source: Trade Data Monitor (TDM). Year-to-date volume for each market, through its latest reported month. Bar = volume (MT, adjusted to 30 days), right = change vs same period last year.
Also in this report
Latest news
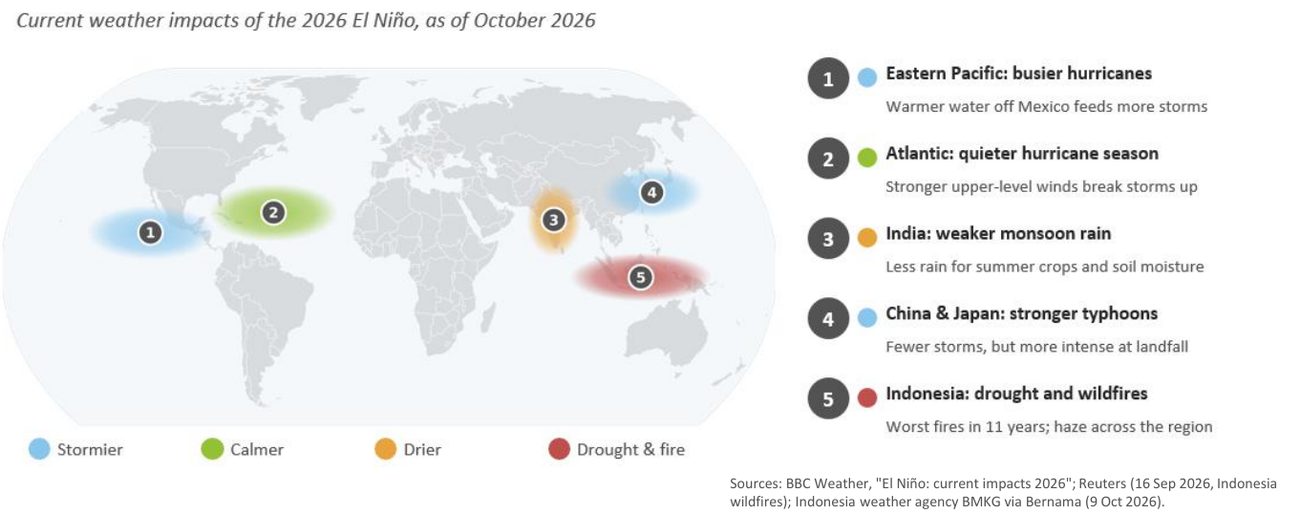
El Niño threatens Southeast Asia’s crops and food prices
A very strong El Niño could cut regional crop output by as much as 10%, while Indonesia faces its worst fires in 11 years and Japan an unusually active typhoon season.
On the Radar
Indonesia’s SMP imports reach record YTD levels
New Zealand is losing share to Australia, Belgium, France and Ireland as US volume keeps shrinking.
Explainer
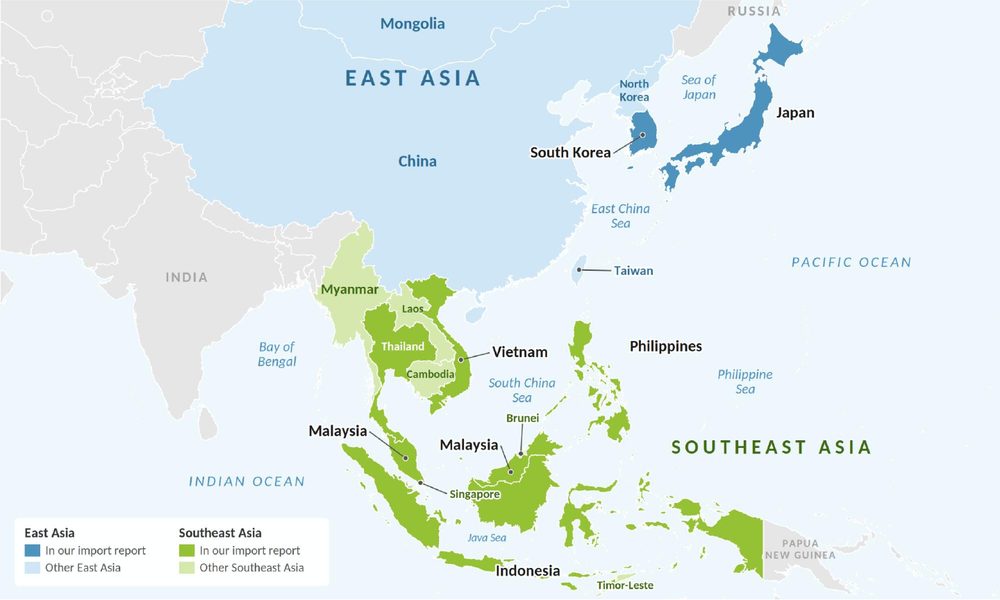
Seven markets, two regions
Which countries the report covers, and why Vietnam’s figures come from its trading partners’ export data.
Source: Trade Data Monitor (TDM). Volumes in metric tons. Adjusted to 30 days. Vietnam uses mirror data (partners’ reported exports into Vietnam); all other countries are country-reported. Latest months differ: July for Vietnam; August for Indonesia, the Philippines and Malaysia; September for Japan, South Korea and Thailand. Full tables, charts and top-5 supplier breakdowns are in the PDF report.
China’s Powder Pull
Key Takeaways
- Whole milk powder (WMP) up 5.9% to $3,971/MT, the highest GDT average since mid-August 2025, as North Asian buyers took 73% of WMP volume, the region’s largest share this year.
- Skim milk powder (SMP) up 3.1% to $4,109/MT, the highest GDT average since late June 2022, with Fonterra’s Medium Heat SMP through $4,000/MT in every contract, while European product gained less and Solarec’s Belgian SMP slipped.
- Milkfats slump: butter fell 4.7% to $4,503/MT, its lowest GDT average since mid-January 2023, and anhydrous milkfat (AMF) dropped 3.2% to its lowest since early October 2023; Solarec’s Belgian lactic butter edged up 0.5% for January shipment while Fonterra’s NZ butter fell more than 6%.
- Cheese rebounds: cheddar up 8.6% to $3,970/MT on aggressive African buying, while mozzarella rose 5.8%, lactose 3.3% and buttermilk powder (BMP) fell 4.4%.
- 39,806 MT sold, down 5.4% from the last auction and up 0.8% from the same auction last year, with 111 winning bidders, up 6.
Auction at a Glance
Global Dairy Trade Auction · Trading Event 415 · 3 November 2026
| Commodity | $/MT | $/lb | Change vs last auction* |
|---|---|---|---|
| Whole Milk Powder (WMP) | $3,971 | $1.80 | +5.9% |
| Skim Milk Powder (SMP) | $4,109 | $1.86 | +3.1% |
| Anhydrous Milkfat (AMF) | $5,306 | $2.41 | −3.2% |
| Butter | $4,503 | $2.04 | −4.7% |
| Buttermilk Powder (BMP) | $4,312 | $1.96 | −4.4% |
| Cheddar Cheese | $3,970 | $1.80 | +8.6% |
| Mozzarella Cheese | $4,104 | $1.86 | +5.8% |
| Lactose | $1,728 | $0.78 | +3.3% |
| Avg Winning Price | $4,166 | $1.89 | +3.0% |
Source: Global Dairy Trade (GDT Insight). *Change in the GDT price index vs the last auction. Prices are average winning prices across all contracts. Click a commodity to explore it below.
Explore by Commodity
Interactive charts load here.
Source: Global Dairy Trade (GDT Insight) trading event results, last three years to TE 415 (3 November 2026); HighGround Dairy analysis. Prices in US dollars; $/lb converted from $/MT (÷ 2,204.62). C1–C6 = Contracts 1–6, shipping one to six months after the auction month. Buying-region shares and bidding-round detail are from GDT auction results as reported in the HighGround analysis.
Prefer the PDF? It’s still there.
Every interactive report keeps the full HighGround PDF, with the same analysis, tables and charts in the format you already use. Click Download PDF Report at the top of any report to save, print or forward it.
Get every report as it’s published
Subscribers get each interactive report and PDF on release day, plus GDT coverage, price dashboards, release-day data snapshots and our monthly forecast. Not a subscriber yet? Start a free trial to try them yourself.
The reports on this page are the September 2026 US Milk Production, US Dairy Products, US Cold Storage and US Dairy Trade Volume analyses, the 30 October 2026 Asia Dairy Import Volume Analysis and the 4 November 2026 Comprehensive GDT Auction Analysis. Data sources: USDA National Agricultural Statistics Service; USDA Foreign Agricultural Service; Trade Data Monitor; Global Dairy Trade; HighGround Dairy calculations.
HighGround Dairy is a division of HighGround Trading LLC ("HGT"), an Introducing Broker (IB) registered under United States Laws. HGT makes no representations or warranties regarding the correctness of any information contained herein, or the appropriateness of any transaction for any person. Nothing contained herein shall be construed as a recommendation to buy or sell commodity futures or options on futures. This communication is intended for the sole use of the intended recipient. HGT is a member of the National Futures Association. Futures and options trading involve substantial risk and is not suitable for all investors. Therefore, individuals should consider their financial situation before trading. Option traders should be aware that the exercise of a long option will result in a futures position. The valuation of futures and options may fluctuate, and as a result, clients may lose more than their original investment. PAST PERFORMANCE IS NOT NECESSARILY INDICATIVE OF FUTURE RESULTS. All information, communications, publications, and reports, including this specific material, used and distributed by HGT shall be construed as a solicitation for entering into a derivatives transaction.