Consumer spending accounts for nearly 70% of total US GDP, making it one of the most significant indicators of economic growth. In Q1 2026, US GDP was reported at 2.1% by the U.S. Bureau of Economic Analysis, rising from the initial reading of 2.0%, as revisions to investments and imports only slightly offset a significant downward revision to consumer spending. With inflation once again on the rise, posting 4.2% in May, the highest in nearly three years, American finances are being threatened by higher costs.
Debt and Serious Delinquencies on the Rise
The US economy is becoming more “K-Shaped” due to growing wealth inequality. In other words, a small portion of the US population with significant wealth and assets continues to spend, while the majority of the population, those in the middle- and lower-income classes, see greater difficulties making ends meet and rely more heavily on debt to do so. With debt mounting quickly, the lasting impacts will weigh on consumers’ financial health for longer than their purchases did and could outlast those of previous economic downturns.
According to the Federal Reserve Bank of New York, total household debt reached a record high of $18.8 trillion in Q1 2026. Mortgages accounted for 70% of that total, followed by auto loans (9%), student loans (9%), and credit card debt (7%). That said, the real concern lies in rising delinquency rates. After a downward move in 2020, delinquency rates climbed to 4.8% in Q1 2026, the highest since Q3 2019. A probable cause of this has been the rapid increase in inflation during this time period. For example, between January 2021 and May 2026, consumer prices have jumped 27%. Effectively, this has reduced consumers’ purchasing power.
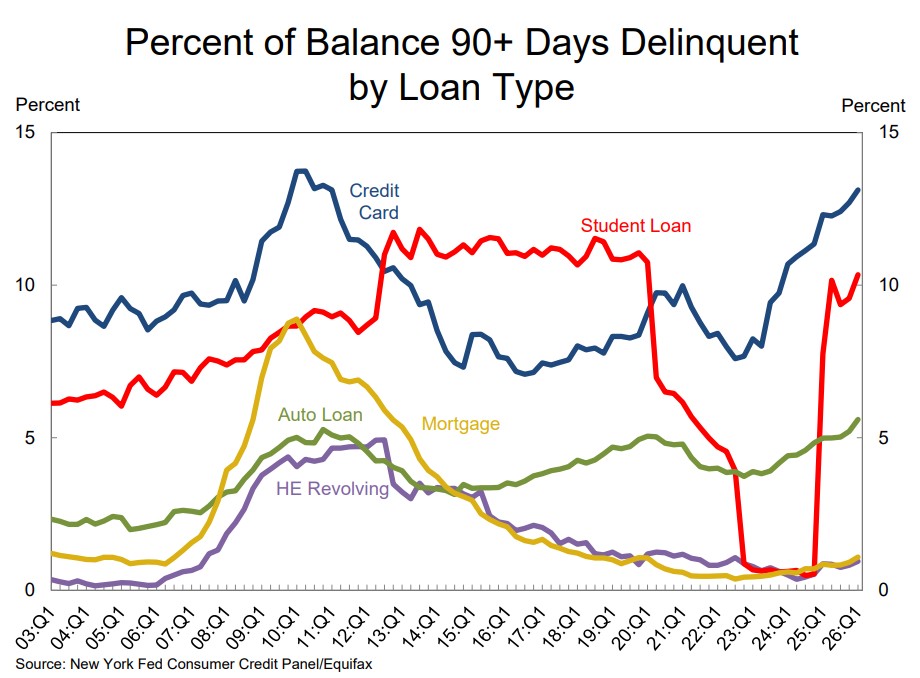
The highest level of delinquency is “serious delinquency,” defined as debt more than 90 days overdue. Serious delinquency on mortgages currently stands at 1.1%, well below the 8% peak observed during the 2008-09 recession. Serious student loan delinquency reached 10.3% in Q1 2026, returning to levels seen prior to the federal student loan moratorium established as part of the COVID-19 relief package. However, there are two other loan types, auto and credit card, where the rapid increase in serious delinquency rates indicates worsening strain on consumer finances. Notably, serious auto loan delinquency, when repossessions typically occur, stood at 5.6% in Q1 2026, the highest on record dating back to 2000. Compared with serious delinquency rates during the 2008-09 recession, auto loan delinquencies are substantially higher in 2026; in 2008-09, they averaged 4.1% and peaked at 5.3% in Q4 2010. Serious credit card delinquency, defined as 90 days or more of default, currently totals 13.1%, its highest level since Q3 2010 (+13.7%), and higher than the 10.9% average for 2008-09.
Rising Interest Rates Add to Headwinds
Still, a significant difference remains: interest rates in 2026 are dramatically higher than during the 2008–09 recession, making every missed payment more expensive and every debt harder to escape. Further analysis comparing current and 2007-09 interest rates also highlights the pain point for consumers. The current Federal Funds Effective Rate is 3.63%, down from the July 2024 peak of 5.33%, providing some relief. However, this rate remained below 0.21% from June 2009 to 2016, and it is unlikely that the current rate will drop back to these levels in 2026 due to rising inflation. For credit cards, the current average interest rate of 21% is higher than the rate during the Great Recession, which peaked at 14.3% in 2010.
Despite the Debt and Interest Rates, Consumers Continue to Spend and Feel the Squeeze
FINRA Investor Education Foundation reported in its 2024 National Financial Capability Study that 20% of respondents in 2009 said they spent more than their monthly income. That number fell to 18% in 2015, but rose to 26% in 2024. Broken out by age, income, and education level, unsurprisingly, those with higher incomes found it less difficult to cover all expenses and pay bills. This was also the case for those with college degrees and those aged 55 and older. The report indicates income, education, and age are correlated with the ability to make ends meet. Only 31% of those aged 18-34 reported being able to make ends meet, rising to 38% among those aged 35-45. These groups, defined generationally as Gen Z and Millennials respectively, have the highest rates of college attainment but report some of the lowest rates of financial solvency, suggesting that the income premium of higher education may no longer be as strong as it once was.
When the study was conducted, the US was emerging from the elevated inflation between 2021 and 2023. Compared with responses following the Global Financial Crisis, the 2024 results pointed to weaker household financial conditions and more pessimistic economic sentiment. The share of respondents reporting difficulty paying bills increased across all three income groups: less than $25,000, $25,000–$75,000, and more than $75,000 annually. Additionally, the percentage of respondents reporting spending less than their income declined across all income levels. Half of the respondents reported that increased housing costs led them to cut back on other spending, while 67% reported that rising food costs have forced them to buy less. The logical conclusion to these data points is that more Americans are unable to make ends meet in 2026 than in 2008-09, implying they are increasingly relying on debt to bridge the gap.
Savings Rate Dwindles
The last piece of the puzzle is savings rates. The FINRA survey reported that 46% of respondents in 2024 had three months’ worth of “rainy day” funds compared to just 35% in 2009. But this survey was conducted in 2024, and since then, personal savings rates have begun to wane due to multiple years of rising costs. As of May 2026, the personal savings rate is just 3.0% of personal income, according to the U.S. Bureau of Economic Analysis. That figure is the lowest since June 2022 and just above the 2.4% personal savings rate recorded in April 2008, when inflation was nearing its peak during the 2008-09 recession.
Financial Stress Will Weigh on Consumers, But Recovery Will Be Slow
Ultimately, the data suggest Americans are under greater financial strain in 2026 than they were during the 2008-09 recession. Total US consumer debt is at an all-time high and serious delinquency rates are once again back to levels observed during the 2008-09 recession; however, interest rates, especially on credit cards, are higher than in 2008-09. Rampant inflation over the past five years has led to more Americans being unable to make ends meet, saving less, and relying on interest-bearing debt to pay bills. That said, this is not an arms race. It is not about who had it worse or who has it worse, but about how to learn from the past to navigate a rocky tomorrow. Over the past 18 years, financial markets have changed, new financial tools have been developed, and financial literacy has become easier to attain. There is a path forward from today, as there was after the 2008-09 recession. Multiple factors established previously in this article suggest the path forward may be difficult and could lead to a slower recovery than in 2008-09, but that will depend on unforeseen economic shifts ahead.